In programming, debugging is the process of identifying and fixing an error in the code. For API consumers and producers, most of the effort is spent on locating the root cause of the issue based on what can be observed.
In an ideal scenario, there is rigorous testing and monitoring in place to alert you when something goes wrong. But even if you don't have this level of observability, let's learn about three ways to increase visibility when debugging APIs.
Prerequisites
- Basic familiarity with Postman and APIs
What You'll Learn
- Explore methods for understanding API behavior, including updating user inputs to change the API response
- Debug and troubleshoot unexpected behavior
- Establish visibility for monitors, webhooks, and CLI
- Isolate dependencies with mock servers
- Set up notifications and alerts
- Explain recommended strategies for debugging
What You'll Need
What You'll Build
- A Postman Collection with working examples for debugging
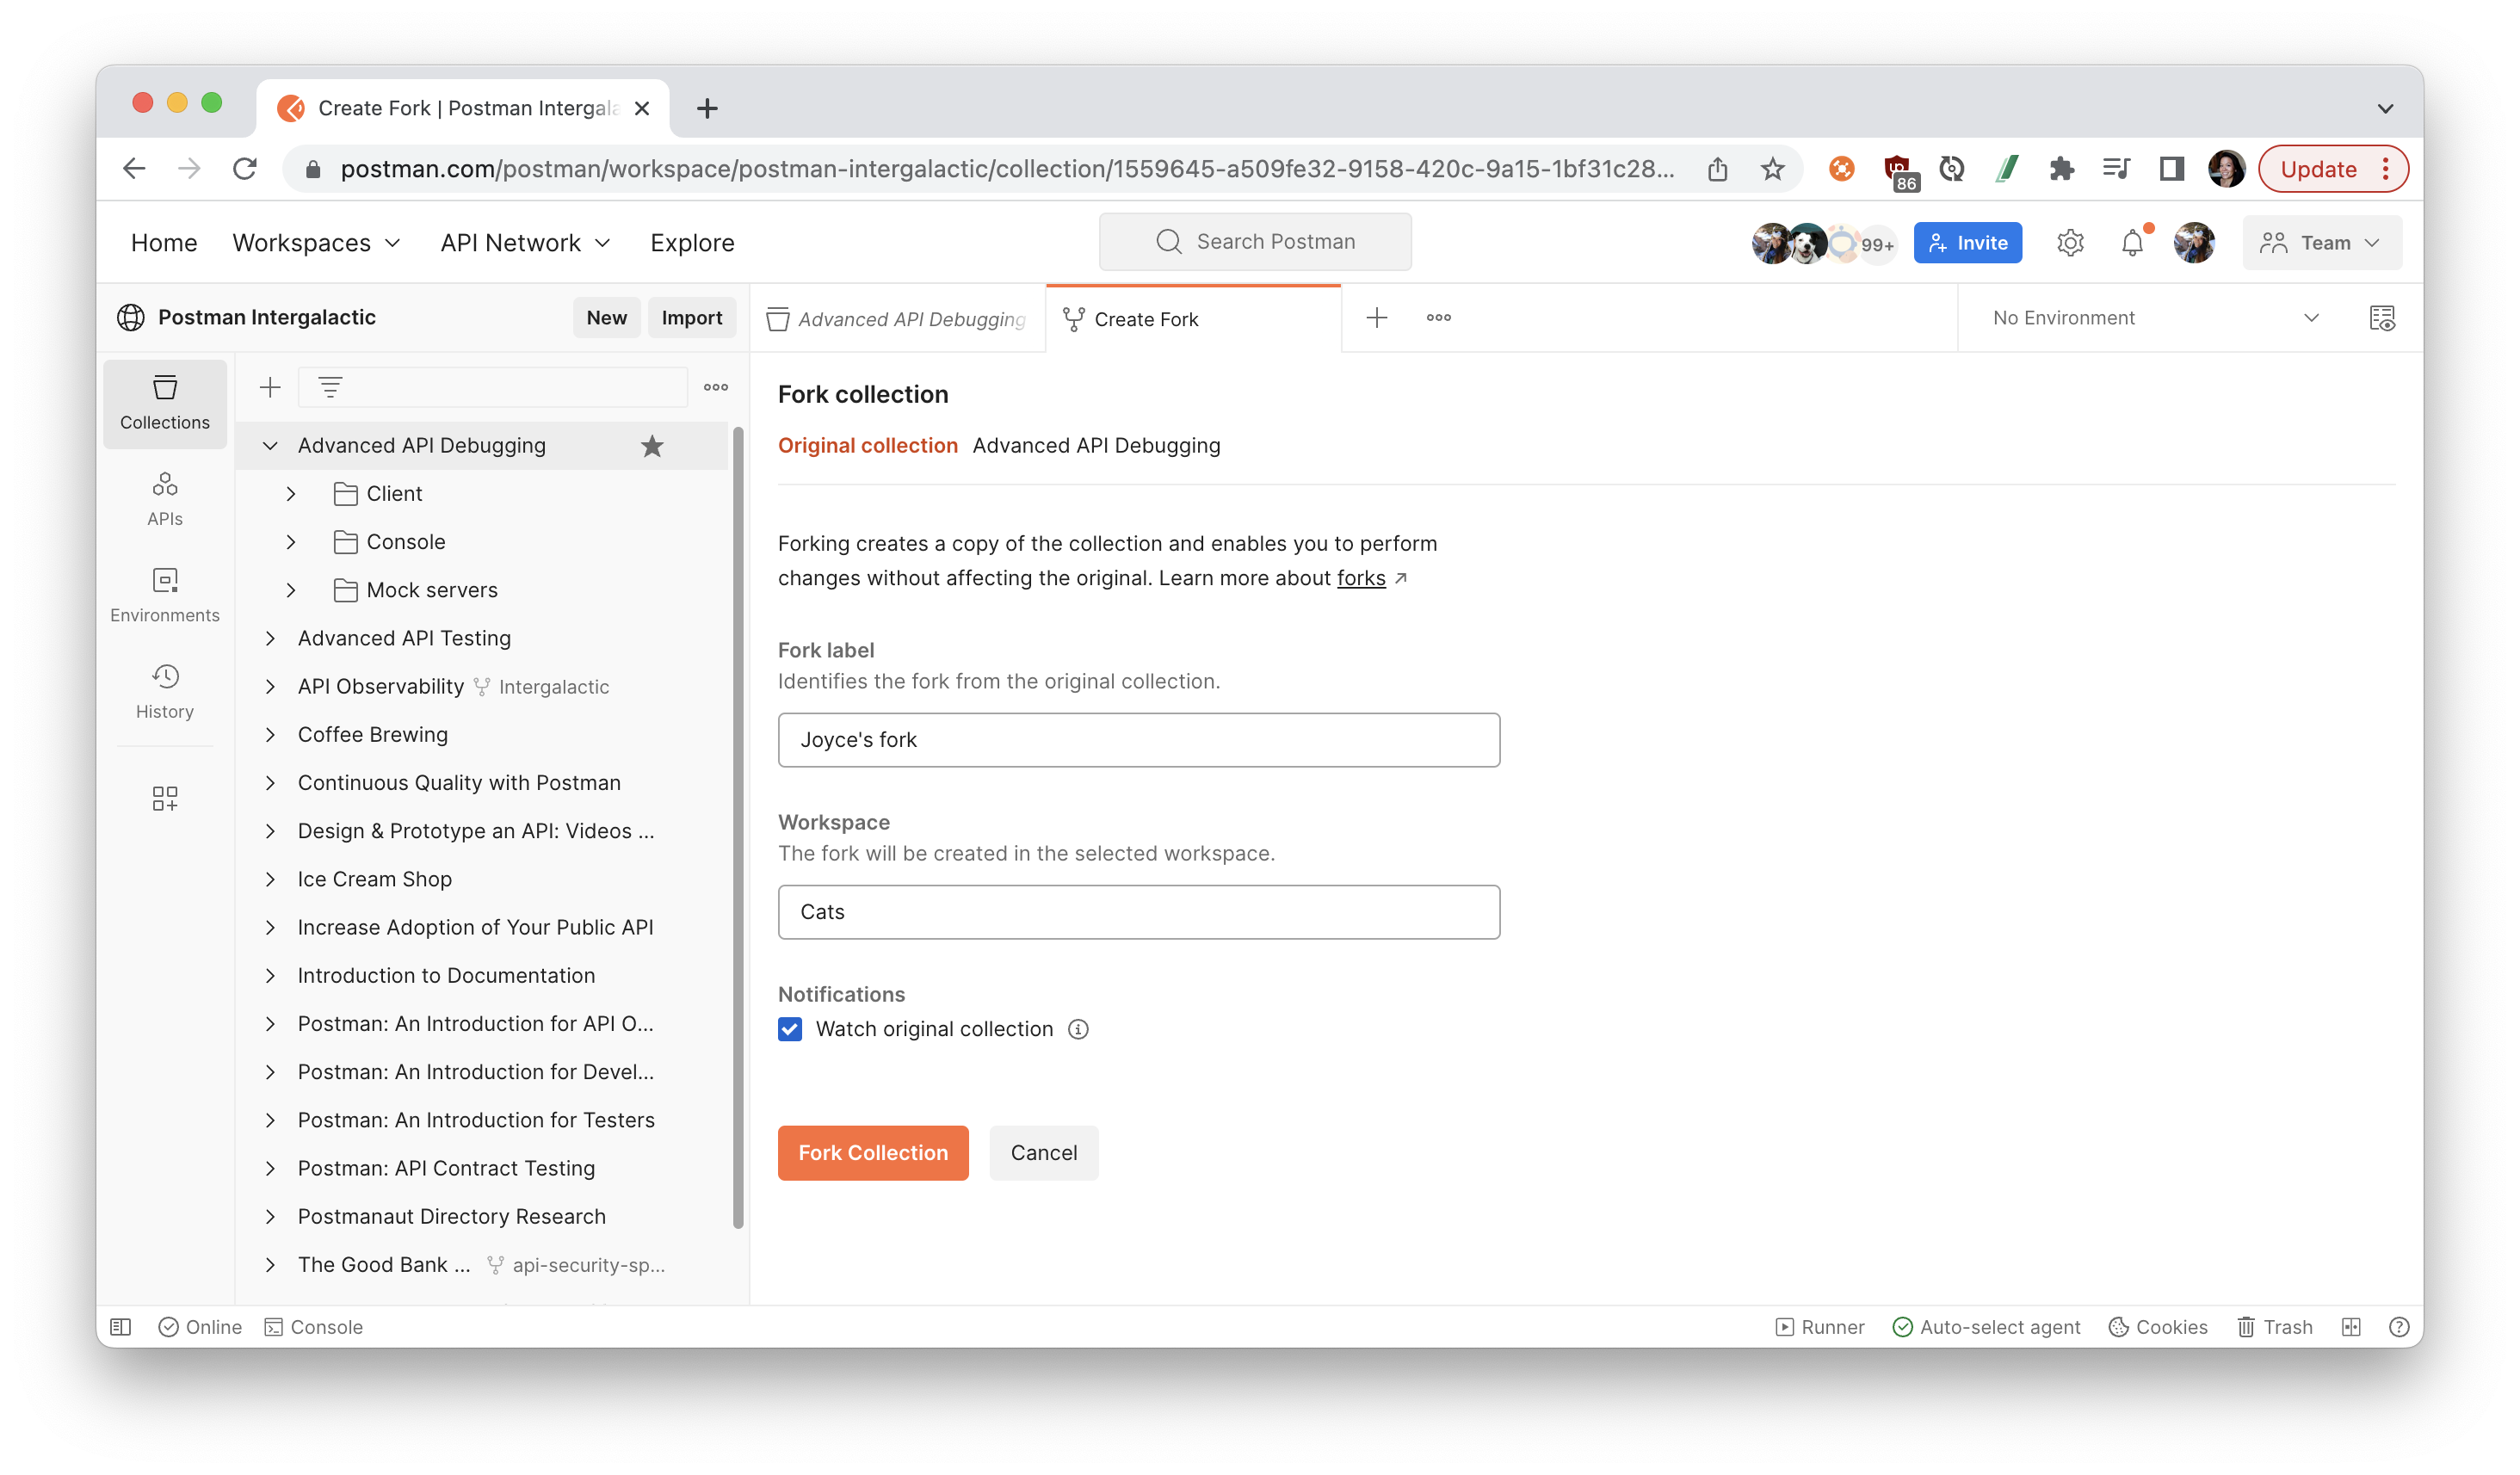
Fork the collection
- Click the orange Run in Postman button below to fork this example collection to your own Postman workspace.

- Enter a label for your fork and select the workspace to fork the collection:
- For the remainder of this tutorial, follow along in the example collection with this video.
Inspect inputs and outputs for API calls
Postman is most commonly used as an API client to explore APIs. Postman allows you to manipulate inputs and inspect the outputs to better understand the relationship between the two. Here are some ways that you can debug more easily using Postman as an API client.
- Select the collection you just forked to your workspace, called "Advanced API Debugging", and expand the folder "Client".
- Follow along with this video, timestamped at API client, to learn more about the following topics.
- Update parameters, headers, and bodies
- See HTTP status codes and error messages
- Parse responses
- Inspect variables
- Review test results
- Replay calls in the History
Knowledge check
Which of these inputs can NOT be updated in Postman?
Postman console for visibility
The Postman console provides visibility into network calls and logs. It is a simple, yet powerful, way to spot bugs. Here are some ways to debug more efficiently using the Postman console.
- Select the collection you just forked to your workspace, called "Advanced API Debugging", and expanding the folder "Console".
- Follow along with the video, timestamped at Console, to learn more about the following topics.
- View network calls and TLS encryption
- Log statements, errors, and warnings
- Inspect variables
- Validate execution order of API calls
- Verify conditional breakpoints set in scripts
Knowledge check
Which log statements are accepted in the Postman console ?
Mock servers for debugging and testing
Mock servers allow you to simulate API behavior using Postman servers. Mocks are frequently used in debugging to simplify a problem or isolate a system under test. Here is how you can debug APIs using Postman mock servers.
- Select the collection you just forked to your workspace, called "Advanced API Debugging", and expand the folder "Mock servers".
- Follow along with the video, timestamped at Console, to learn more about the following topics.
- Simulate edge cases that may be difficult or costly to run in production (for example, 429 Too Many Requests)
- Stub out dependencies on third-party services or internal microservices
- Establish a starting point for a scenario or inject a call within a scenario
Knowledge check
Which of these is NOT required to set up a mock server in Postman?
Follow along with the rest of the Advanced API Debugging video to learn about the following topics.
- General debugging strategies
- Tools and tactics for an API call
- Tools and tactics for a sequence of API calls
- Integrations for monitoring and observability
Knowledge check
Which of these debugging strategies can you use in Postman?
Additional resources
- Debugging with the Console video
- Reverse engineering an API: using the Postman proxy video
- Mock servers video
What we've covered
- Explore methods for understanding API behavior, including updating user inputs to change the API response
- Debug and troubleshoot unexpected behavior
- Establish visibility for monitors, webhooks, and CLI
- Isolate dependencies with mock servers
- Set up notifications and alerts
- Explain recommended strategies for debugging
If you want to stay in the loop with Postman Intergalactic webinars, register for upcoming sessions or sign up to get notified about upcoming sessions.